
Background
Premier Paint Llc is a leader in quality paint manufacturing in the Pacific Northwest with a growing market share of North American paint sales. Company executives rely on timely and accurate information from finance personnel, sales managers and manufacturing staff in order to assess company financials and key performance indicators. However, data is siloed and integrated and prepared manually by company staff, making data less useful than it could be.
Project Objectives
The purpose of this project was to integrate and prepare data from Premier’s various source systems, including it’s financial database, point-of-sale (POS) system, and manufacturing database, into one semantic model linked to a dashboard. The dashboard brings together the company’s major expense and revenue metrics, sales and production data, as well as it’s manufacturing “feedstock” into view for company managers to gain insights and take appropriate action.
Final Solution
A link to the live report is available here

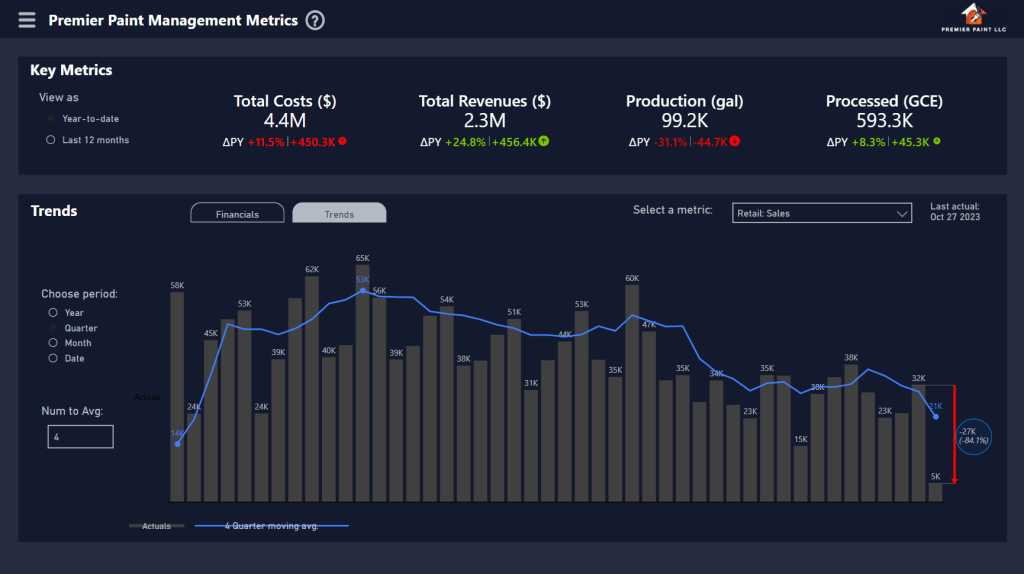
The report follows standard visualization hierarchical design with key metrics presented at the top-most portion of the dashboard. These key metrics can be viewed on a year-to-date basis, or on a rolling 12-month basis with a click

The bottom portion of the dashboard allows company staff to drill-down into a view of financials, where they can set a relevant date range and view year-over-year trends in major costs and revenues.
Alternatively, staff can view trends in each metric by selecting one or more relevant metrics, an appropriate period granularity, and moving average parameter in order to see trends with ease.

